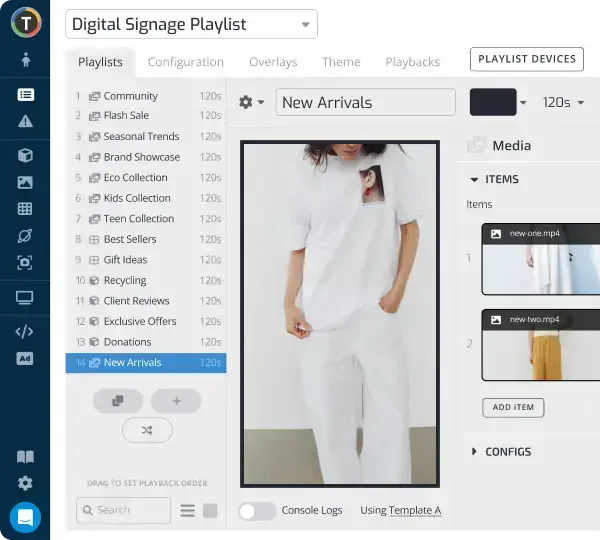


From Data To Dashboards, The Metrics App Makes It Easy To Monitor All Your Business KPIs.
Visualize data in any format.
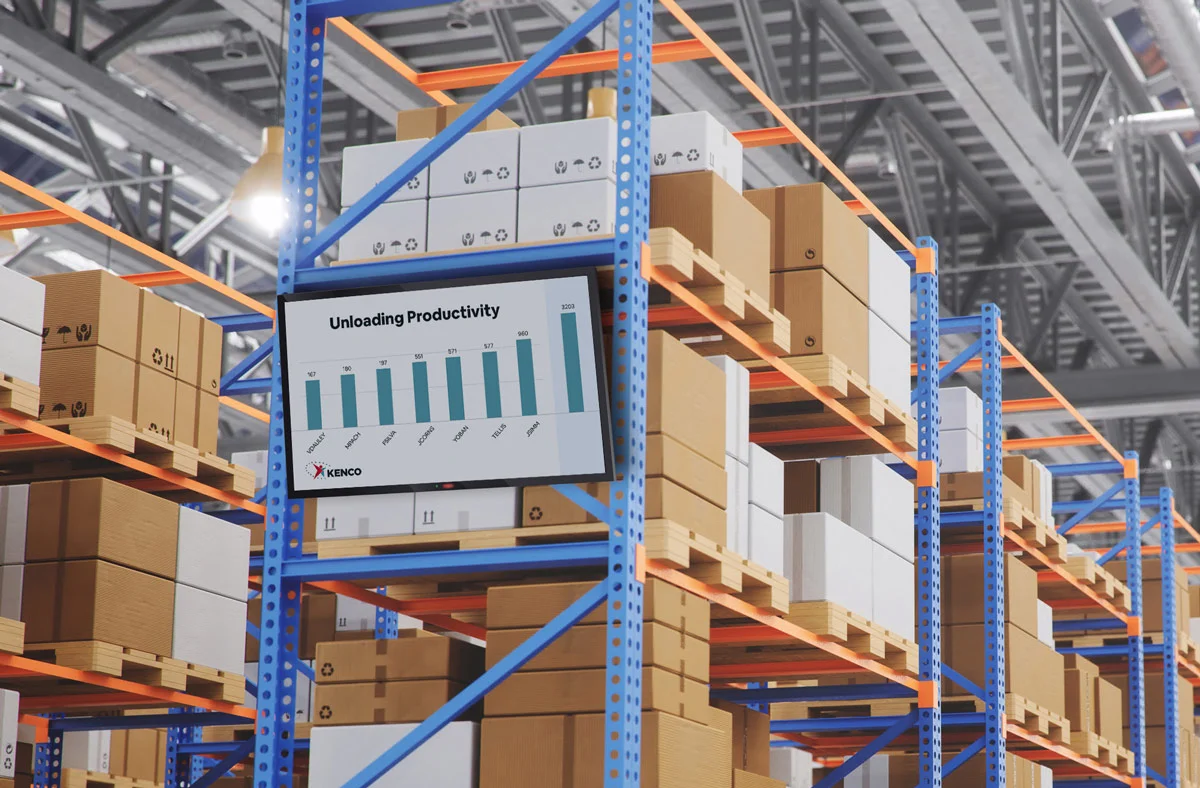
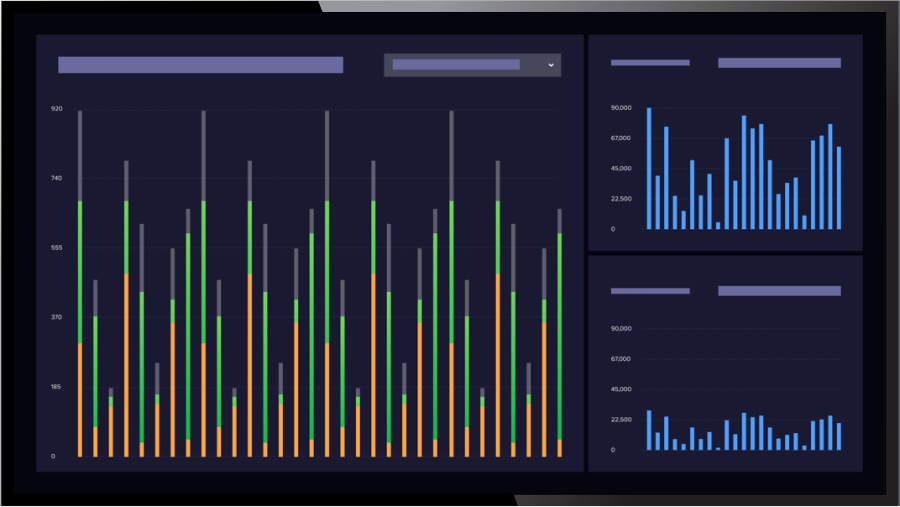
Metrics Bar Chart
Visualise a Metric in real-time through a bar graph. The graph can be stylized as a Spline, Line, Area, Scatter, Bar, Stacked Bar or Horizontal Bar and with a color design of preference.
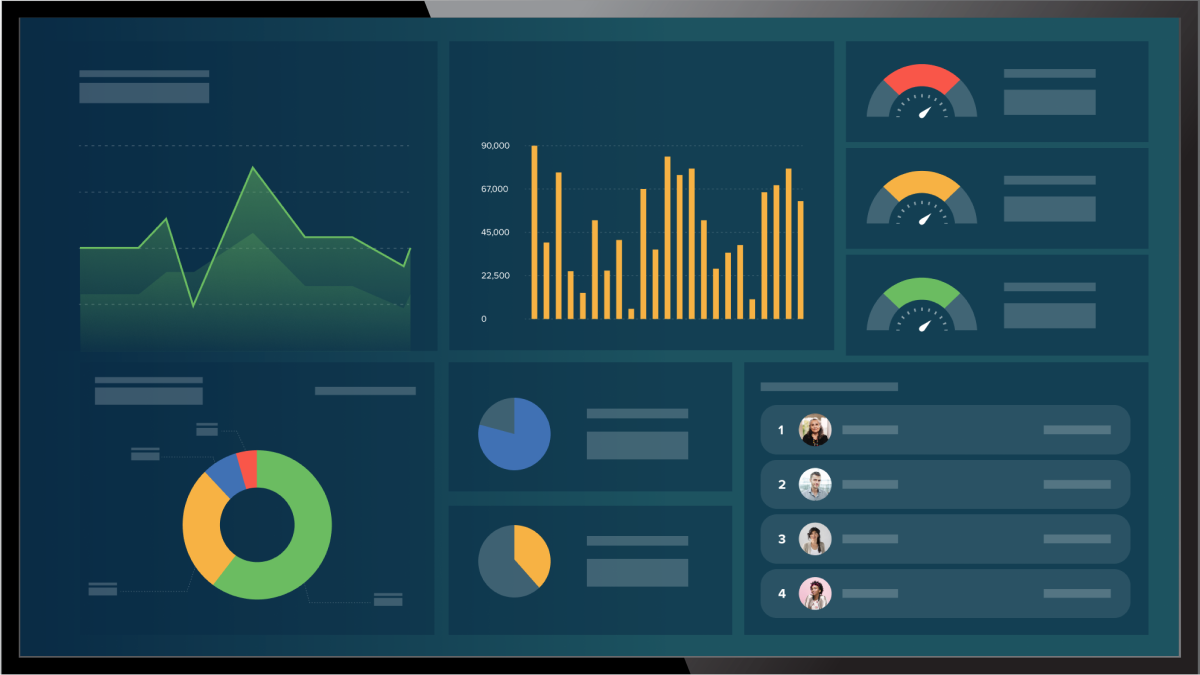
Metrics Gauge
Track progress towards a goal, current performance, or other KPI visualizations.

Metrics Leaderboard
Display real-time table data ranked from highest to lowest. Rank your team's activities such as who closed the biggest deal, highest customer support reply times, top selling products and more.

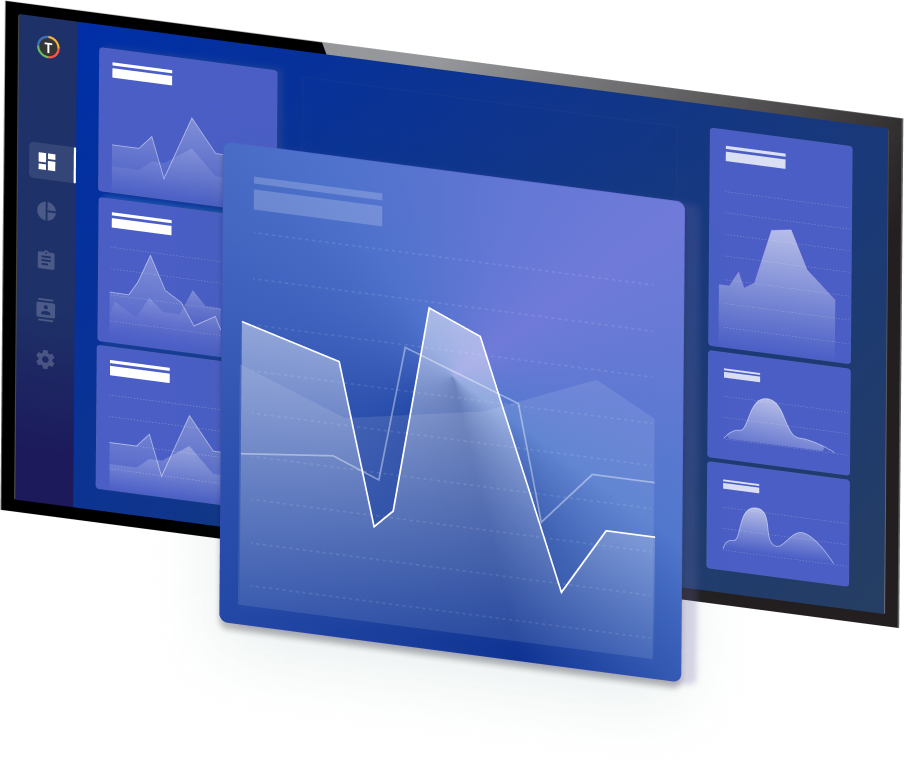
Metrics Line Chart
Compare the values of multiple Number Metrics through a Line Chart. Track sessions per source, sales by region, or even demographics.
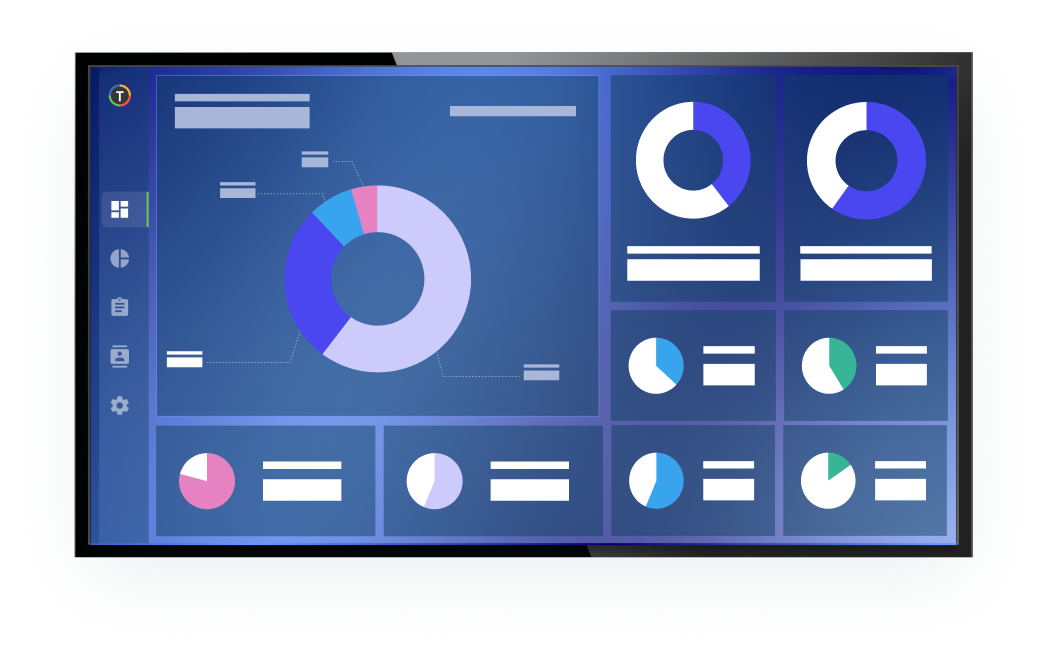
Metrics Pie Chart
Compare the values of multiple Number Metrics through a Piechart. Track sessions per source, sales by region, or even demographics.
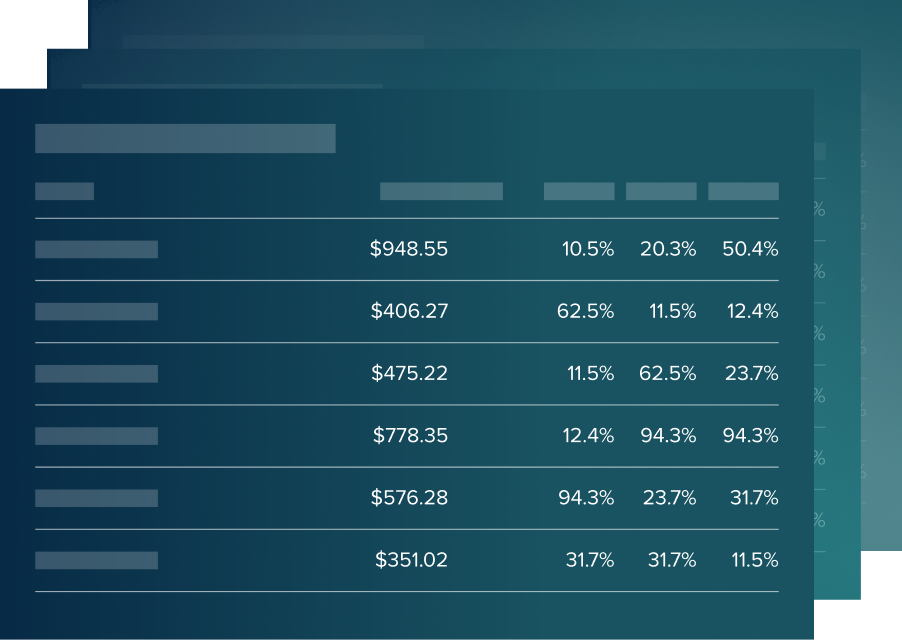
Metrics Table
Using a table format allows users to compare, rank, and view metrics across your organization. Compare past months output for a detailed view of changes over time.
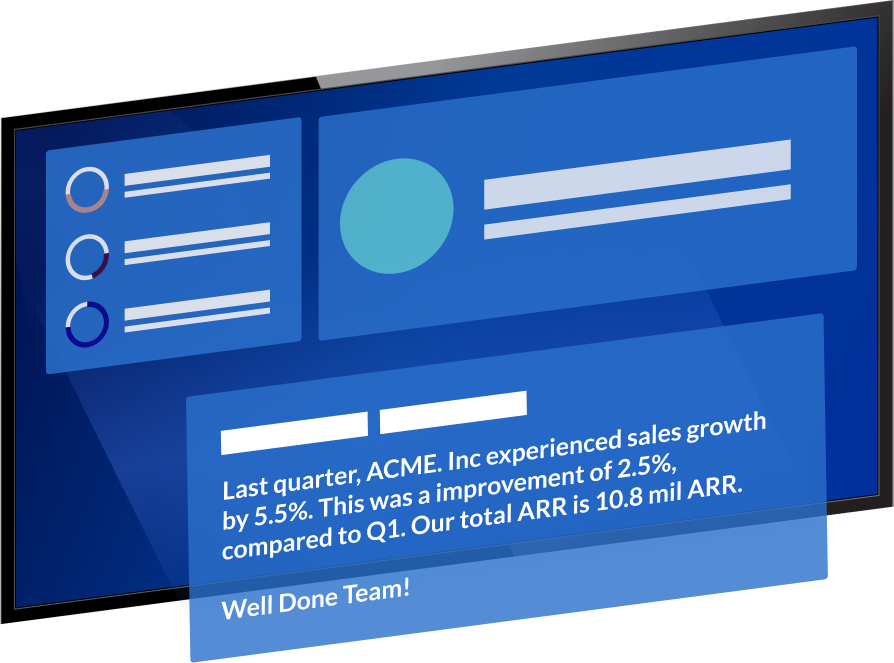
Metrics Text
Share text with your team through comments or add additional data to your dashboard. This is a great tool for providing context to a dashboard or further instructions.
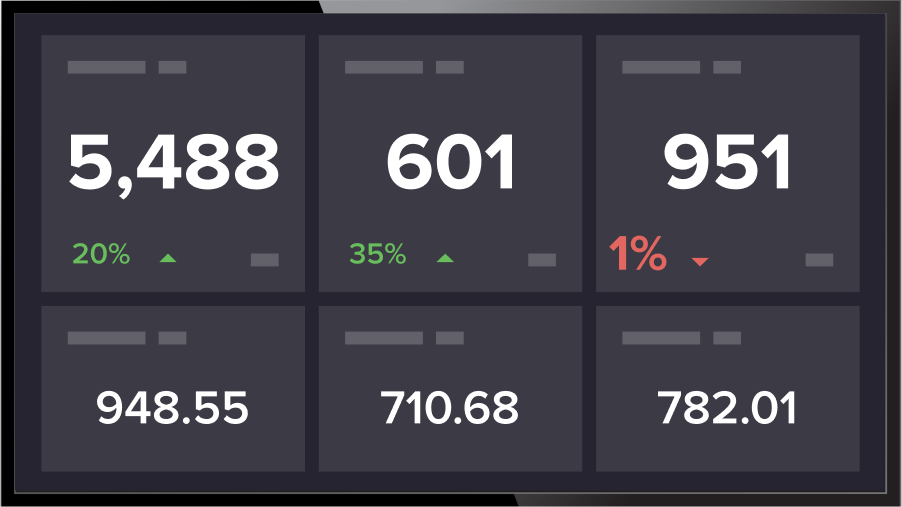
Metrics Number
Draw attention to individual numbers with the numbers metric.
Customers Love TelemetryTV
TelemetryTV’s powerful and intuitive cloud-based software makes managing and deploying digital signage systems easier than ever before.


