


Navigating the Sea with Realtime Sensors Analytics
WRITTEN BY: TelemetryTV, 10-04-2014
With the advent of mobile digital sensors, the internet of things, and real time visualizations, the seafaring world is innovating and capturing efficiencies never seen before in marine instrumentation history.
Tasks like engine room log entries are now automated and executed with more accuracy, frequency, and at less cost with sensors and software.
Data collection is no longer limited to assets on board the vessel allowing for better data analysis, insights, and real-time decision making.
And new technologies are being built in open systems allowing for an ecosystem of hardware and software integrations to flourish and a community of data and insight sharing to proliferate.
Joe Burke, an electrical engineer and inventor of marine instrumentation at Chetco Digital, remembers when the ship engineer had to tour the engine room every 30 minutes. He would record what he saw on the analog dials and manually write them into the transportation log. He would then use formulas to calculate when certain auxiliary equipment like the flywheel, shaft bearings, or generator needed maintenance. This method was prone to time lag, mis-written recordings, and human error.
“But those days are numbered” says Mr.Burke, who began working on instrumentation systems nearly 30 years ago, first calibrating altimeters for F-16 fighter jets, then designing algorithms for tracking vessels underwater as a software for the Apple II computer.
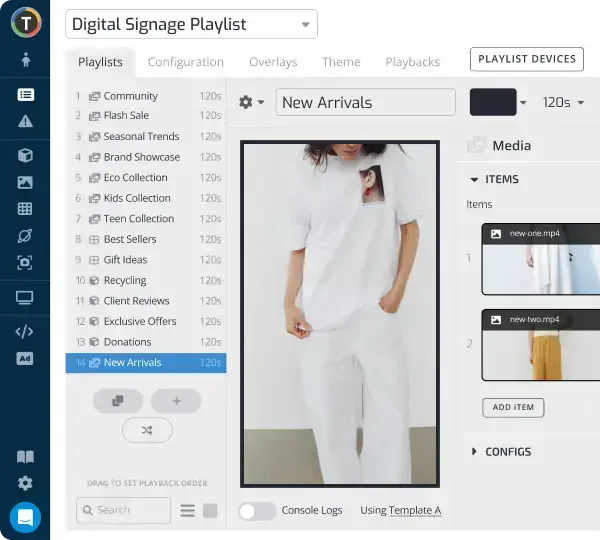
“Now we have mobile sensors for marine vessels that can be installed directly to on-board assets, like the engine, fuel tank, battery, or generator to monitor specific sets of data over time. These data sets can be stored on a hard drive or flowed in realtime to a HelmSmart server via 3G wireless network and fed into a software application like Telemetry. Telemetry gives you the ability to create real time data visualizations and securely broadcast metrics to key personnel on and off the vessel. Or to personnel on land managing a fleet of vessels.”

And because the data visualization software, Telemetry, uses a simple REST API it can ingest its data from disparate sources. It’s not limited to strictly on board vessel data. A Ship Engineer can now create a real-time dashboard comprising of both environmental data (like barometric pressure and approaching weather systems), AIS information (which tells you the direction, speed, cargo, and size of ships near you) and on-board vessel metrics. Ultimately, the dashboard is a powerful tool for understanding the current health of the vessel and surrounding environment.
Mr Burke says, “In the past, technology in the marine industry has typically been closed, but that’s changing, and I’m excited that we’re moving towards an open, more distributed system” which allows for sharing of information, collaboration, and rapid innovation.“There is a new horizon upon us and I’m excited to see what things may come.”